Explorar las categorías
Explora
Fiverr Pro
Español
$
USD


Traducción automática
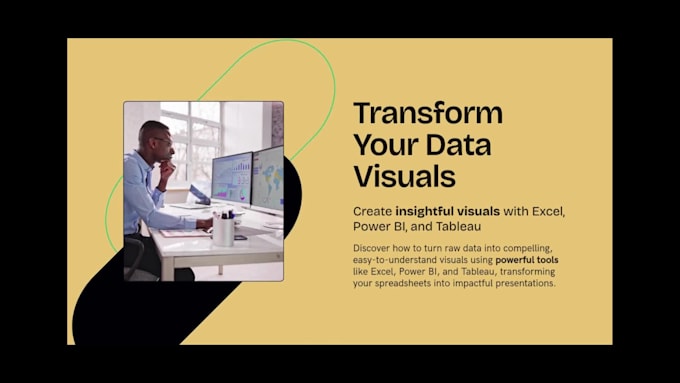
¿Tienes datos en bruto y quieres convertirlos en algo significativo?
Te ayudaré a descubrir insights poderosos analizando y visualizando tus datos con herramientas como Excel, Power BI, Tableau y Google Data Studio. Ya sea informes de ventas, KPIs de marketing o resultados de encuestas, transformaré tus hojas de cálculo o bases de datos en paneles interactivos y historias visuales que sean fáciles de entender y listos para tomar decisiones.
Recibirás:
Análisis limpio y estructurado
Gráficos y visualizaciones atractivas
Un panel personalizado (si es necesario)
Resumen de los hallazgos clave
¡Hagamos que tus datos hablen y trabajen para ti, no en tu contra!
Digital Marketer
Idiomas
Traducción automática
Traducción automática
¿Con qué tipo de datos puedes trabajar?
Puedo trabajar con archivos de Excel, CSV, Google Sheets, bases de datos y más.
¿Qué herramientas utilizas para el análisis de datos?
Excel, Power BI, Tableau.
¿Puedes limpiar y preparar datos en bruto antes del análisis?
Sí, puedo limpiar y estructurar tus datos en bruto para que estén listos para un análisis significativo.
¿Qué tipos de visualizaciones puedes crear?
Gráficos de barras, líneas, pasteles, mapas de calor, paneles de control y muchos más.
¿Explicarás los conocimientos encontrados en los datos?
Sí, siempre incluyo un resumen o explicación de los conocimientos clave.
¿Puede manejar grandes conjuntos de datos?
Sí, hasta un límite razonable. Por favor, envíame un mensaje antes de ordenar si el archivo es muy grande.
¿Necesito tener conocimientos técnicos para entender tu entrega?
Para nada. Explico todo de forma sencilla y fácil de entender.
¿Qué pasa si necesito cambios o actualizaciones después?
Recibirás revisiones gratuitas durante el pedido. Después, estaré encantado de ayudarte con actualizaciones por una pequeña tarifa.
¿Puedes crear paneles para presentaciones empresariales?
¡Por supuesto! Me especializo en paneles listos para presentaciones.
¿Proporcionarás un informe con el análisis?
¡Por supuesto! Proporcionaré un informe detallado que resuma el análisis y las visualizaciones.