Haré visualización de datos usando Tableau y PowerBI

W
wyckliff
W
wyckliff
Dr. W. Herberts
Parte de la información se ha traducido automáticamente.

Acerca de este Servicio

Traducción automática

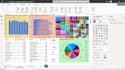
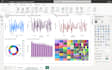
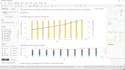
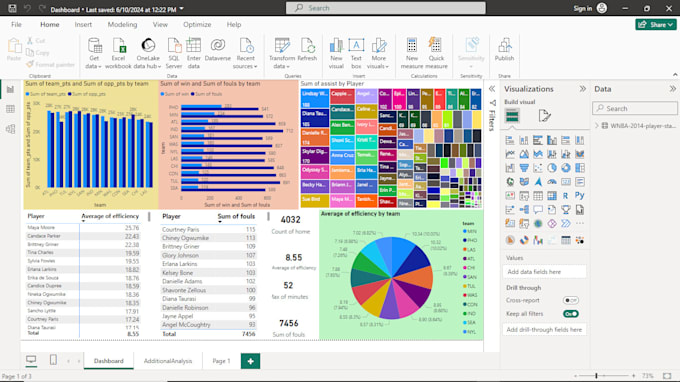
Visualización de datos usando Tableau y Power BI, para mostrar hojas, historias y paneles. Los visuales incluyen gráficos de líneas, gráficos de barras, histogramas, mapas, diagramas de árbol, gráficos de pastel y muchos más visuales disponibles en Tableau y Power BI

Conoce a Dr. W. Herberts

Dr. W. Herberts

Engineering design, FEA, CFD using SolidWorks, ANSYS, Inventor Pro

4.3(1)
  • DeKenia
  • Miembro desdeabr 2020
  • Responde aprox. en:1 hora
  • Última entrega1 mes
  • Idiomas

    Inglés
I am an Industrial engineer with design skills in Inventor Pro, SolidWorks, and ANSYS Workbench. I can perform conceptual design and FEA & CFD tasks and complete them efficiently. I have 7 years' technical experience in engineering research and design. Also, I can use a wide range of statistical tools to conduct data analysis. The software I can use include SPSS, EViews, JASP, JMP, STATA, Power BI, Ms Excel, and Tableau. I can handle project scheduling and resource allocation tasks: Gantt, WBS, Critical Path using MS Project, Project Libre, and flow charts using Ms Visio and Draw.io

Traducción automática

Mi porfolio