Parece que este servicio está en espera

I will transform your raw data into interactive, dynamic dashboards

V
venwi1176
V
venwi1176
Panwi K
Parte de la información aparece en idioma inglés.

Acerca de este Servicio

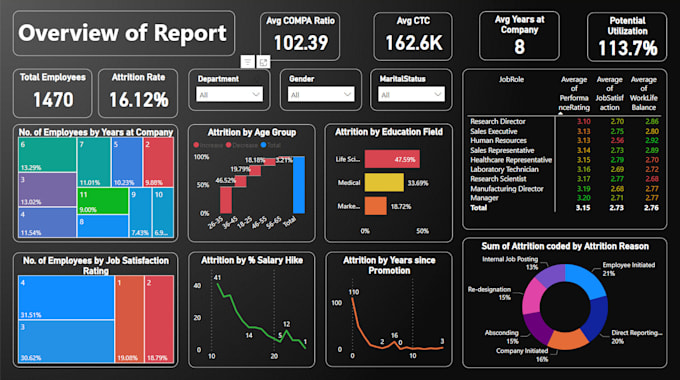
DATA VISUALIZATION | DASHBOARDS | POWER BI |


Hola!

I'm an expert in Power BI, Python, and Excel. if you want to transform your raw data into insightful, interactive and dynamic dashboards. Feel free to contact me.


Please contact me, if there are any special requirements in your project for data visualization.

Tool I'm proficient in:

  • Python
  • Tableau
  • Power BI

My services include:

  • Basic charts and graphs (line, column, pie, bar, cards)
  • Advanced Charts (matrix, area, waterfall, maps, etc)
  • Slicers (as per the package selected)
  • No missing value handling (unless discussed prior)


Note*: Please contact me before placing an order


Thanks!

Conoce a Panwi K

Panwi K
  • DeIndia
  • Miembro desdedic 2023
  • Idiomas

    Hindi, Inglés, Español
Do you want to transform your raw data into insightful, visually captivating dashboards, have a logo that defines you, or turn your ideas into 3D models? Then look no further! Hola! I'm Panwi Kumar, a Business School Student skilled in dashboard design, data analytics, website design, Logo design, and 3D modeling. I can help you turn complex data into meaningful stories, make websites that attract customers, design logos that showcase your uniqueness, or turn your ideas into 3D models. I'm proficient in R Studio, Python, HTML, CSS, Excel, PowerPoint, Power BI, Canva, and Blender.