Parece que este servicio está en espera

I will create KPI dashboards for business insights and performance

T
tyler__buckley
T
tyler__buckley
Tyler B
Parte de la información aparece en idioma inglés.

Acerca de este Servicio

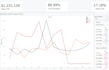
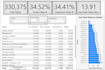
I create clean, KPI dashboards that help you quickly understand your data and make better decisions. I work primarily in Excel and Power BI, with Tableau available depending on your needs and package.


If you're working with spreadsheets or raw data and want clear KPIs, trends, and performance insights, I'll turn your data into a dashboard that's easy to use, filter, and update.

What you'll get

  • A professionally designed KPI dashboard tailored to your data
  • Clear layout focused on performance and insights
  • Data cleaned and structured for reporting
  • A dashboard that's easy to maintain going forward

Data sources supported

  • Excel
  • CSV files
  • Google Sheets
  • (Other sources available upon request)

I focus on clarity and usability, not cluttered visuals. Before starting, I'll review your data and confirm requirements so the final dashboard matches exactly what you need.

If you're not sure which metrics to track, I can help suggest KPIs based on your business goals.


Basic packages focus on snapshot reporting, while Standard and Premium include interactive dashboards. A walkthrough or presentation is included in the Premium package.


I am here to help. Please reach out with any questions.

Conoce a Tyler B

Tyler B

Business Data Analyst

  • DeEstados Unidos
  • Miembro desdeene 2026
  • Idiomas

    Inglés
I am here to help businesses turn raw data into clear, decision-ready dashboards and reports. I build KPI and business dashboards that highlight what’s working, what’s not, and where to focus next in a simple, easy-to-understand way. I work primarily in Excel, Power BI, and Tableau, with an emphasis on clean structure, usability, and clarity. My work focuses on data analysis, performance reporting, and data visualization so the final result supports real decisions, not just charts and visuals.