Explorar las categorías
Explora
Fiverr Pro
Español
$
USD


As a Biotechnology student, I help researchers, professors, biotech startups, and communicators transform raw data into publication-ready figures and engaging infographics.
I can offer:
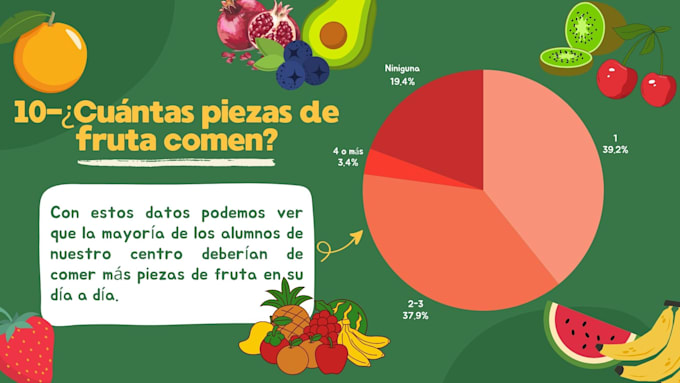
-Publication-Ready Charts: Bar graphs, scatter plots, & statistical charts formatted from Excel/CSV files.
-Biological & Chemical Diagrams: Custom metabolic pathways, cell structures, lab protocols, & mechanisms of action.
-Visual Abstracts & Infographics: Full summaries combining data, diagrams, and text for papers or posters.
-Presentation-Ready Slides: Clean vector graphics embedded into PowerPoint/Canva.
I have scientific Accuracy, I speak your language without misinterpretation of technical terms. I'm able to create clean, modern designs for academic (Nature, Science) or corporate standards and give you crisp PNG, PDF, SVG, or source files ready for print or web.
Tools: BioRender, Excel, Canva, PowerPoint and many more
Feel free to message me before ordering to discuss your custom project!
Scientific content creator, data visualization specialist
Idiomas
What format should I provide my data in?
You can send your data in Excel, CSV, Google Sheets, TSV, or TXT files. If you only have a hand-drawn sketch or text description of a biological process/pathway, that works perfectly too!
Are the graphics suitable for peer-reviewed journal submission?
Yes! All graphics and figures are designed to meet high-resolution standards and color palettes required by major scientific journals such as Nature, Science, Cell, Elsevier, or ACS.
Will my research data remain confidential?
Absolutely. I understand the sensitivity of unpublished scientific research and IP. Your data and figures will never be shared, published, or reused without your explicit consent.
Do you provide editable source files?
Yes! Depending on the package or add-on selected, I can deliver fully editable files so you can make future adjustments.
Do I need to explain the scientific concepts to you in detail?
As a Biotechnology student, I am familiar with core concepts in microbiology, genetics, biochemistry, and lab protocols. You just need to provide your raw data or abstract, and I will understand the context without needing extensive explanations.