Explorar las categorías
Explora
Fiverr Pro
Español
$
USD

Expert in Custom Forms, Data Cleaning and Excel Dashboards
Habilidades
Revisa mis servicios
Data Engineer
Deutsche Gesellschaft für Internationale Zusammenarbeit • Tiempo completo
Jan 2021 - Jul 2022 • 1 yr 6 mos
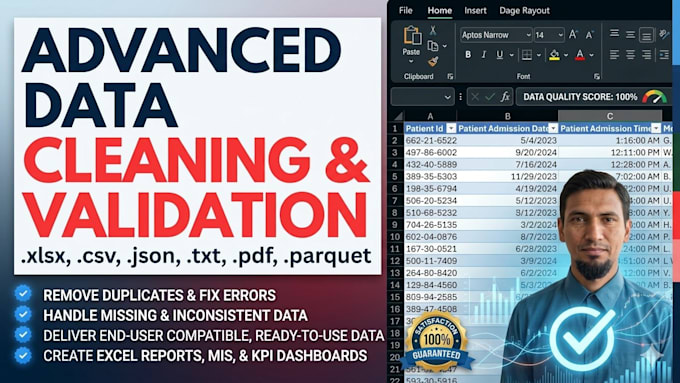
Data Analyst – GIZ / WASCA Project October 2021 – July 2022 Worked as a Data Analyst supporting hydrological and water-resource planning projects, focusing on data cleaning, transformation, analysis, reporting, and visualization. Cleaned and standardized 30,000+ records daily using Excel and Power Query, and used Python (Pandas) for larger datasets beyond Excel’s capacity. Performed data cleaning, validation, duplicate removal, null handling, data-type corrections, and standardization. Used Excel formulas, Pivot Tables, Power Query, and data analysis techniques to summarize and analyze datasets. Prepared clean, structured datasets for MIS reports, analytical reporting, and decision-making. Created interactive dashboards using both Microsoft Excel and Power BI, including charts, slicers, filters, KPIs, and drill-downs. Used Power BI and DAX to create calculated columns, measures, KPIs, and dynamic analytical metrics. Used SQL to extract, filter, join, aggregate, and analyze data for reporting requirements. Performed data quality checks to ensure accuracy, consistency, and reliability of analytical outputs. Transformed raw and complex datasets into clean, structured, and analysis-ready data for reporting and visualization. Key Achievement: Transformed large and diverse datasets into reliable analytical data and interactive dashboards, helping stakeholders understand trends and make informed decisions.
