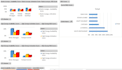
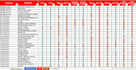
Business data analytics is a involves the uses of a specific set of techniques, competencies, and procedures to perform the continuous exploration, iteration, and investigation of past and current business data, for the purposes of obtaining insights about a business that can lead to improved decision-making.
Excel is an inherently part of the enterprise-BI-tool portfolio. Hence, we see several significant advantages of using Excel as the platform for your dashboards and reports These benefits
includes:
- The Excel custom dashboard provides
a central location for users to access, interact and analyze up-to-date
information so they can make smarter, data-driven decisions.
- The Excel dashboard will help
managers and business leaders in tracking key KPIs or metrics and take timely
business decisions on it.
- It
provides statistical visual aids such as charts/tables that are backed
by objective data.
- Using
it manager will suggest action plans for each outlet based on the gaps actual
vs targets shown
- Excel is a cost-effective way to
deliver key business reporting tools without compromising too deeply on
usability and function.