Explorar las categorías
Explora
Fiverr Pro
Español
$
USD

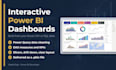


Drowning in spreadsheets? I turn your Excel, CSV, Google Sheets or SQL data into a clean, interactive Power BI dashboard that shows what is working and what to fix.
WHAT YOU GET
- Data cleaned and modelled in Power Query
- Accurate KPIs and DAX measures (sales, profit, growth, averages, YoY)
- Interactive visuals: slicers, drill-down, KPI cards, charts, maps, gauges
- A clear layout built for managers, not analysts
- The .pbix file plus a short walkthrough of how to use it
PERFECT FOR
Sales dashboards, KPI and performance reports, survey analysis, finance and operations reports, and any business that wants one clear view of its data.
HOW IT WORKS
1. Send your data and the questions you want answered
2. I confirm scope and share a layout plan
3. I build, you review, I revise
4. You receive the final dashboard and guide
WHY ME
BS in Artificial Intelligence (FAST-NUCES), hands-on Power BI work with real survey data, and a focus on reports that are accurate and easy to read.
Message me before ordering so we can confirm your data fits.
Power BI Developer, Dashboards, DAX and Data Modelling
Idiomas


