Explorar las categorías
Explora
Fiverr Pro
Español
$
USD


Traducción automática
Mi objetivo es crear visualizaciones de datos increíbles basadas en la web que faciliten compartir conocimientos de datos.
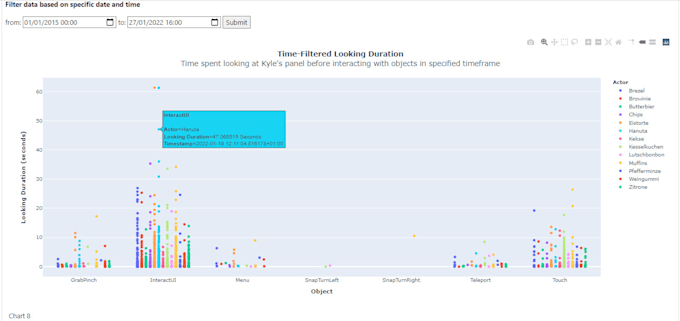
Como analista de datos y estudiante de Maestría en Ciencia de Datos (RWTH Alemania), he trabajado en varios proyectos relacionados con Ciencia de Datos. Puedo extraer información útil de grandes volúmenes de datos que están en forma de archivos CSV/Text para ofrecer insights y mostrarlos en gráficos claros e interactivos usando diferentes bibliotecas de Python (es decir, Pandas, PyPlot y Seaborn, etc.) y bibliotecas de Javascript (es decir, D3.js, JSCharting y Three.js, etc.)
No dudes en usar el botón de Favoritos para contactarme más rápidamente para tus próximos proyectos.
¡Siempre soy flexible con los precios según tu presupuesto y requisitos!
¡Espero contar contigo pronto :)
Technology Evangelist
Idiomas
Traducción automática