Explorar las categorías
Español
$
USD
Conecta tu IA a Fiverr

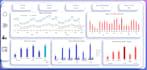
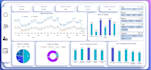
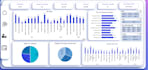

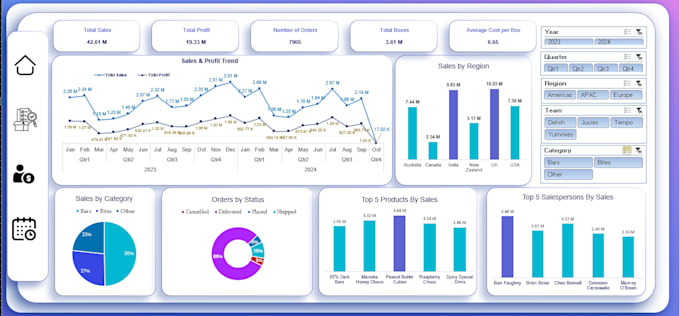
Do you have sales or business data in Excel and want to see it in a clear dashboard? I will turn your data into an interactive Excel dashboard that is easy to read and easy to use.
What you get:
- KPI cards for your main numbers
- Charts that show trends, top items, and comparisons
- Slicers (filters), so you can explore by date, region, category, and more
- A clean layout with simple colors
I use PivotTables, PivotCharts, and slicers in Excel. In the Pro package, I also build a data model that connects several tables.
What I need from you:
- Your Excel or CSV file
- The main questions you want the dashboard to answer
- Any KPIs or colors you prefer (optional)
I have built a 4-page sales dashboard as a sample project, and you can see it in my portfolio. I care about accuracy and clear design, and I will message you if something in your data is not clear.
If your data needs heavy cleaning first, message me before ordering so we can plan it.
Idiomas
What do you need to start?
Your Excel or CSV file, and a short note about what you want to see in the dashboard.
Do you work with messy data?
I can fix small issues. If the data needs heavy cleaning, message me before ordering.
Will the dashboard update when I add new data?
It can, if the data is in a table and you refresh the PivotTables. I will explain how in the delivery message.
What do I receive?
An Excel file with your dashboard, and a short note that explains how to use it.