I will provide data analysis and visualization using r or python

Parte de la información aparece en idioma inglés.

Egipto

Hablo Inglés, Árabe, Español, Alemán

151 pedidos completados

I am a medical illustrator and animator, and a data analyst

my hobbies: - medical illustration design, infographics and mind maps - unlock protected pdf files to enable printing. - i love medical research very much. - Data science of healthcare datasets

Nivel 1

Ha cumplido determinados criterios de rendimiento y muestra un gran potencial en la plataforma.

Acerca de este Servicio

kindly contact me before placing the order, there is always an offer for everyone :)

Hi there, I'm a Medical intern and Data scientist. my goal is to use data analysis to find solutions and to make sure that the outcome is outstanding.

I have experience in python and R programing and have used them many times for medical research and metanalysis. in addition to medical knowledge and data analysis, I have 5 years of experience in medical illustration and graphic design. so I will give an informative and eye catching data visualization models.

I'm using these tools:


1- Python

2- R studio

3- SPSS

4- power Bi


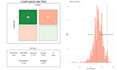
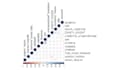
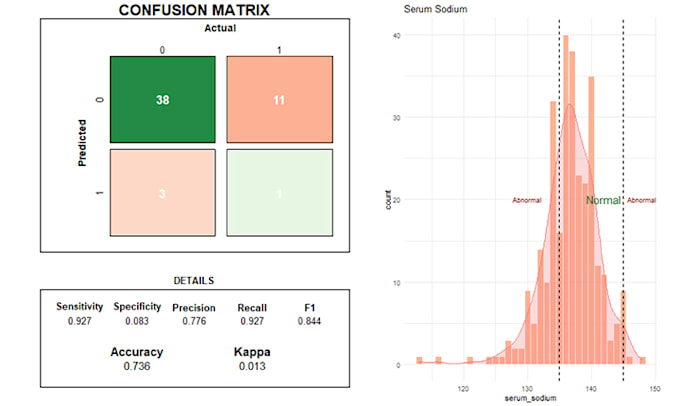
I will provide you the in the analysis of your data with proper explanations for your understanding with your desired graphs such as:

  • Scatter Plots
  • Pie Charts
  • Histograms
  • Bar Charts
  • Point Maps (for geo location)
  • Spatial Maps (regional/polygonal data)
  • Route Maps
  • And many more


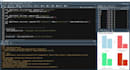
Statistical Analysis in RStudio:

  • Hypothesis tests
  • t-test
  • Median test
  • ANOVA Tests
  • MANOVA
  • Binomial test
  • Chi-square
  • Fishers exact test
  • Parametric and Non-Parametric tests
  • Other statistical tests in r
  • machine learning models such as decision tree, random forest, XGBoost and provide cross-validation.

Lenguaje de programación:

Python

R

SPSS

Tecnología:

Excel

MATLAB

Power BI

Stata

Tableau

SPSS

Tipo de análisis:

Análisis cuantitativo

análisis estadístico

Experiencia:

Algoritmos

probabilidad

Estadísticas

Herramientas:

Jamovi

Minitab

RStudio

Stata

Otros

Mi porfolio