Explorar las categorías
Explora
Fiverr Pro
Español
$
USD


Traducción automática
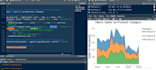
¿Buscas visualizaciones de datos impresionantes e informativas? ¡No busques más!
Según tus necesidades, crearé gráficos, diagramas y plots llamativos usando R. Me especializo en varios paquetes de visualización como ggplot2, plotly, lattice y más. Recibirás visualizaciones en alta resolución, listas para publicación en varios formatos (PNG, JPEG, PDF).
Lo que ofrezco:
Gráficos de barras, líneas, dispersión, histogramas, gráficos de pastel, boxplots, mapas de calor, violin plots y otros gráficos potentes.
Por qué elegirme:
Por favor, ten en cuenta:
Antes de hacer un pedido, comunícate conmigo con tus requisitos específicos y muestras de datos. Los precios y el tiempo de entrega variarán según la complejidad del proyecto.
Business Analyst, Power Bi, Power Automate, Python, R
Idiomas
Traducción automática
Traducción automática
¿Qué tipos de visualizaciones de datos puedes crear en R?
Creo una amplia variedad de visualizaciones de datos en R, incluyendo gráficos de barras, gráficos de líneas, diagramas de dispersión, histogramas, boxplots, mapas de calor, violin plots, gráficos de pastel y paneles interactivos usando plotly. Todas las visualizaciones están diseñadas para propósitos empresariales, académicos y de investigación.
¿Qué paquetes de R utilizas para la visualización de datos?
Principalmente uso ggplot2, plotly, lattice y otras bibliotecas avanzadas de visualización en R para ofrecer gráficos de alta calidad, listos para publicación. Elijo el paquete más adecuado según las necesidades de tu proyecto (estáticos vs interactivos).
¿Puedes crear gráficos y paneles interactivos?
Sí, me especializo en visualizaciones de datos interactivas usando R (plotly, Shiny). Estas permiten a los usuarios explorar los datos de forma dinámica, lo que las hace ideales para inteligencia empresarial y reportes.
4. ¿Qué formatos de archivo recibiré?
Recibirás archivos de salida en alta resolución en formatos como PNG, JPEG, PDF y, si es necesario, el código fuente en R para reproducibilidad y futuras ediciones.