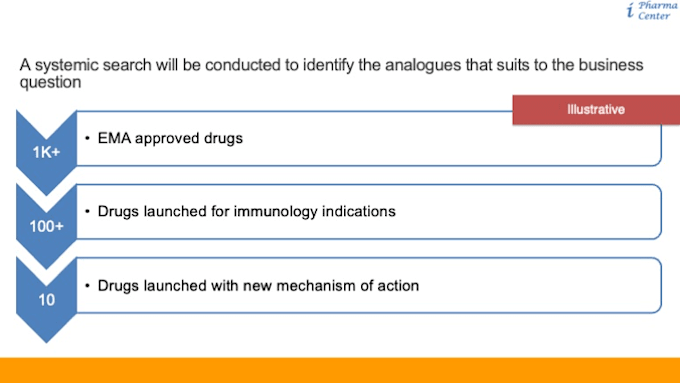
Las cifras de ventas de datos en pharma y salud, el estado del pipeline, métricas de acceso al mercado y seguimiento de ensayos clínicos solo son útiles si puedes ver claramente qué está pasando con un vistazo. Creo paneles interactivos y claros que convierten datos dispersos en algo que tu equipo puede usar para tomar decisiones rápidamente.
Lo que cubre:
- Paneles de rendimiento de ventas y comerciales tendencias de ingresos, cuota de mercado, desglose por regiones
- Paneles de seguimiento del pipeline estado de ensayos clínicos, progresión por fases, visualización de cronogramas
- Paneles de acceso al mercado y precios estado de reembolso, comparaciones de precios entre mercados
- Paneles de inteligencia competitiva seguimiento de productos de la competencia, posicionamiento, actividad en acuerdos
- Paneles de KPI y rendimiento métricas personalizadas basadas en lo que tu equipo realmente monitorea
Herramientas en las que trabajo:
- Power BI paneles interactivos con filtrado detallado, ideales para equipos ya en el ecosistema de Microsoft
- Tableau visualizaciones pulidas y listas para presentar informes a los interesados
- Excel paneles dinámicos con tablas dinámicas y gráficos, ideales para equipos que necesitan algo ligero y fácil de actualizar por sí mismos