Transforming Data into Clear, Professional and Publication Ready Visual Insights
Pakistán
Inglés, Urdu
Parte de la información aparece en idioma inglés.
Sobre mí
Hi! I'm Saad, a Data Visualization Specialist who is helping clients to convert complex data into clear, professional and meaningful visual insights.
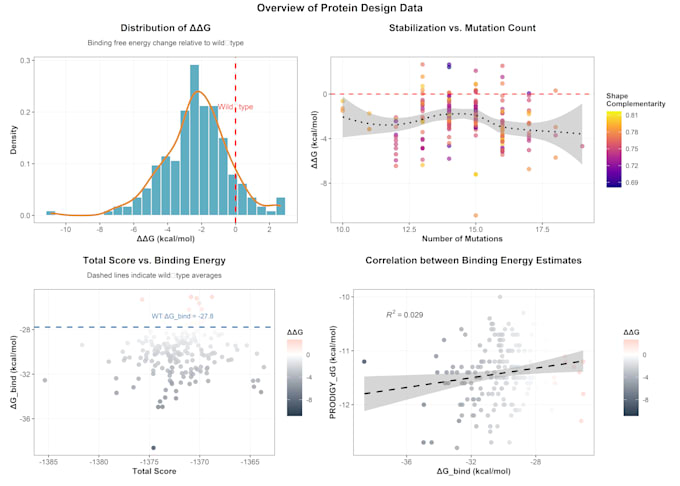
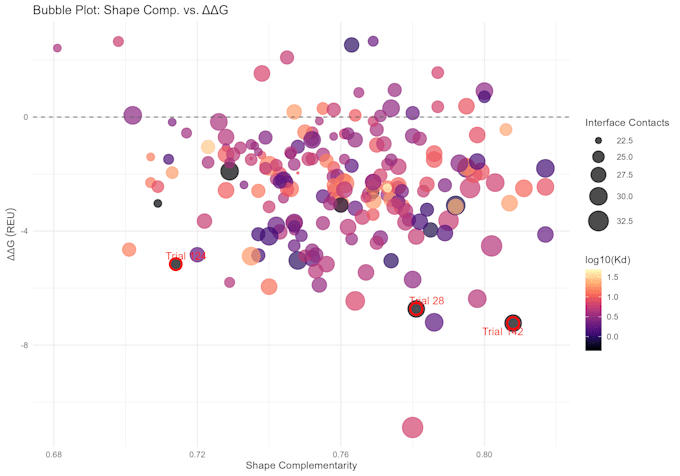
I produce scientific figures and high-quality graphs with R programming, RStudio, ggplot2 and advanced visualization methods. I can create graphs for publication, statistical figures, analyze the data, and make customized figures for research papers, presentations, and reports.
I am an expert on generating neat, informative and aesthetically pleasing charts like scatter plots, box plots, violin plots, heatmaps, PCA plots and more.... Lee más