Explorar las categorías
Explora
Fiverr Pro
Español
$
USD


Traducción automática
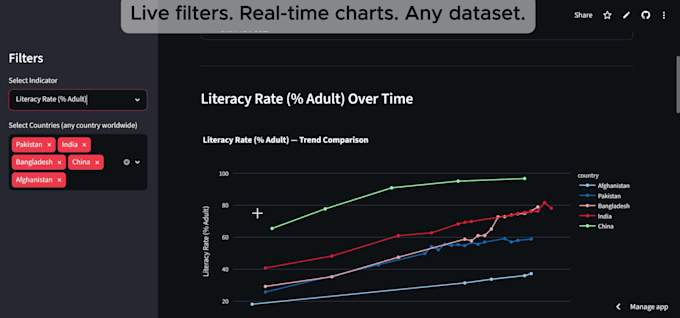
Construyo paneles interactivos y personalizados usando Python y Streamlit, transformando hojas de cálculo en bruto en herramientas visuales, clicables y limpias que hacen que tus datos sean realmente útiles.
Lo que obtienes:
Panel personalizado basado en tus datos
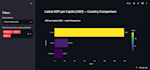
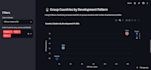
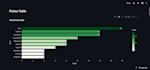
Filtros interactivos y gráficos en vivo (Plotly)
Enlace en vivo desplegado que puedes compartir con quien quieras
Código fuente completo incluido
Perfecto para dueños de pequeños negocios, startups y estudiantes que necesitan una forma clara de rastrear y presentar sus datos, sin necesidad de un conjunto de datos fijo, funciona con CSV, Excel o APIs en vivo.
He creado paneles analizando indicadores de desarrollo global (más de 190 países mediante API en vivo), análisis deportivos (más de 26,000 puntos de datos) y pronósticos económicos, todos visibles en mi portafolio.
Envíame un mensaje antes de ordenar con una muestra de tus datos para poder confirmar el alcance y el plazo.
Data Science and Python Developer for Dashboards, ML Models and Data Analysis
Idiomas
Traducción automática
Traducción automática
¿Necesitas mis datos antes de comenzar?
Sí, comparte una muestra para que pueda confirmar el alcance y el plazo antes de que hagas el pedido.
¿Se puede desplegar el panel en línea?
Sí, despliego en Streamlit Cloud con un enlace en vivo que se puede compartir.
¿Qué pasa si mis datos cambian después?
Puedo hacerlo para que acepte cargas de archivos, así funciona con cualquier dato actualizado.