Explorar las categorías
Explora
Fiverr Pro
Español
$
USD
Analista de datos y especialista en ML: Python R SQL PySpark SPSS SmartPLS
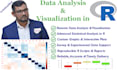
Ofrezco servicios avanzados de análisis de datos en R, incluyendo limpieza de datos, visualización, modelado estadístico, pronósticos, regresión, pruebas de hipótesis, series temporales, análisis inferencial y estudios de correlación. Me especializo en analizar datos de encuestas, académicos, empresariales y de desarrollo para ofrecer insights claros y reportes profesionales. Transformemos tus datos en inteligencia impactante y lista para tomar decisiones.
Paquete básico
Título: Resumen descriptivo de datos
Descripción: Ofrece análisis descriptivos básicos con estadísticas resumidas y visualizaciones.
Características:
Paquete estándar
Título: Análisis inferencial con visualizaciones
Descripción: Realiza análisis inferencial con pruebas de hipótesis y gráficos.
Características:
Paquete premium
Título: Modelado estadístico avanzado
Descripción: Realiza análisis avanzado incluyendo correlación y modelado de regresión.
Características:


Traducción automática
¿Qué tipo de análisis puedes realizar usando R?
Puedo realizar una amplia variedad de análisis en R, incluyendo estadísticas descriptivas, pruebas inferenciales, regresión, correlación, ANOVA, análisis de series temporales, visualización de datos (ggplot2) y más. También manejo datos de encuestas y experimentos de manera eficiente.
¿Qué tipo de archivos aceptan?
Trabajo con archivos .csv, .xlsx, .sav y .txt. Asegúrate de que tus datos estén limpios y bien estructurados. Si no, puedo ayudarte a limpiarlos si lo solicitas.
¿También proporcionarás el código en R?
¡Sí! Siempre entrego scripts en R limpios y bien comentados, especialmente en los paquetes Premium, para que tú o tu equipo puedan entender y reutilizar el análisis.
¿Puedes generar gráficos y visualizaciones de calidad para publicación?
¡Por supuesto! Utilizo ggplot2, plotly y otras librerías de R para crear visualizaciones de alta calidad y personalizables, aptas para uso académico o profesional.
¿Puedes ayudar con tesis, investigaciones o informes de monitoreo y evaluación?
Sí, apoyo proyectos académicos y de investigación analizando datos y resumiendo insights. Sin embargo, no escribo artículos completos ni los presento en nombre de los clientes.


