Explorar las categorías
Explora
Fiverr Pro
Español
$
USD


Traducción automática
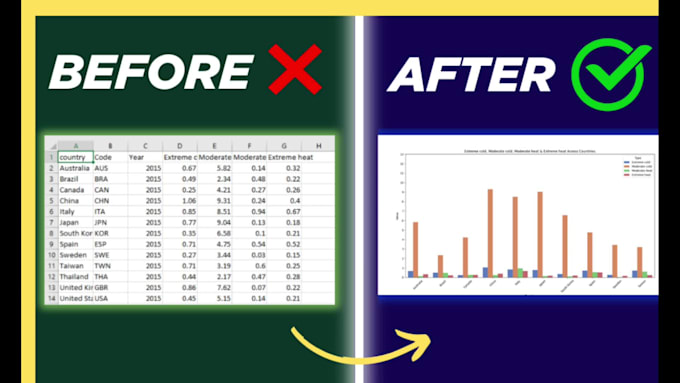
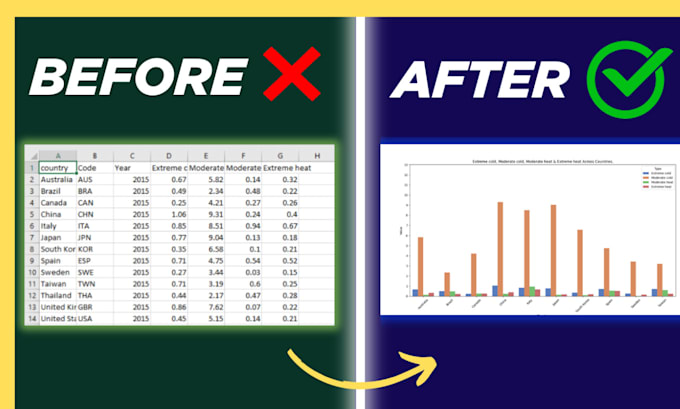
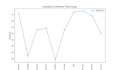
Si buscas gráficos o charts de visualización de datos personalizados, estás en el lugar correcto.
Estoy aquí para crear gráficos de líneas y gráficos de barras para ti. Crearé charts infográficos y gráficos comparativos de tus datos. Seré tu experto en visualización de datos usando python.
¿POR QUÉ PUEDO SER TU MEJOR OPCIÓN?
Usos de los charts infográficos y gráficos comparativos:
Habiendo dicho eso, te aseguro que crearé o desarrollaré los mejores gráficos de barras comparativos o de variación o gráficos de líneas, ya que valdrá la pena y te ayudará a expandir tu negocio.
Requisito:
Palabras clave: desarrollar gráficos de líneas, charts infográficos, gráficos de barras, gráficos comparativos, gráficos de líneas.
Website Developer and Data Analyst
Idiomas
Traducción automática
Traducción automática
¿Requiere cargos adicionales por el código fuente?
No, es gratis.
¿En qué idioma será el código fuente?
Será en python.
¿Qué herramienta usaré para graficar gráficos o charts?
Puedo usar diferentes librerías en python, incluyendo Pandas, seaborn, matplotlib y numpy.
¿Puedo cambiar el tema del gráfico?
Sí, puedes decirme cualquier tema, ya que Seaborn tiene cinco temas diferentes: (1) "darkgrid", (2) "whitegrid", (3) "dark", (4) "white" y (5) "ticks"
| (1) | ||
| (0) | ||
| (0) | ||
| (0) | ||
| (0) |

bouz11

Marruecos
The delivered high-quality work exactly as promised—and even ahead of schedule. Communication was smooth and professional throughout the project. They understood my requirements perfectly and went above and beyond to ensure I was happy with the final result. Highly recommend and will definitely work with them again in the future!
USD50-USD100
$
6 semanas
Tiempo

Respuesta del Freelancer
| (1) | ||
| (0) | ||
| (0) | ||
| (0) | ||
| (0) |
bouz11
Marruecos
The delivered high-quality work exactly as promised—and even ahead of schedule. Communication was smooth and professional throughout the project. They understood my requirements perfectly and went above and beyond to ensure I was happy with the final result. Highly recommend and will definitely work with them again in the future!
USD50-USD100
$
6 semanas
Tiempo
Respuesta del Freelancer