Explorar las categorías
Explora
Fiverr Pro
Español
$
USD
AI Machine Learning Data Science Deep Learning Data Analytics
Do You Have Data But Don't Know
What It's Telling You?
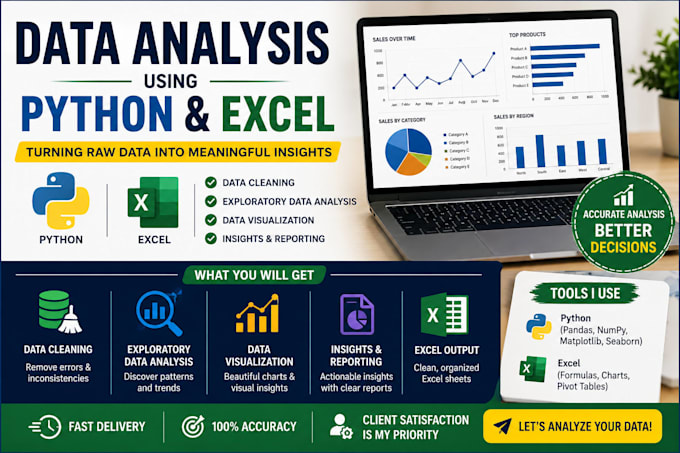
I will perform professional data analysis and create stunning visualizations using Python that turn your raw data into clear, actionable insights!
WHAT I WILL DO:
VISUALIZATIONS I CREATE:
️ TOOLS I USE:
WHAT YOU NEED TO PROVIDE:
Message me BEFORE ordering
FREE consultation!
What format should my data be in?
CSV or Excel works perfectly. Any size dataset is fine!
What kind of charts can you make?
Bar, Line, Pie, Scatter, Heatmap, and Interactive Plotly dashboards!
Will I get the source code?
Yes! Clean Python code included in all packages.
My data is messy — can you still help?
Absolutely! Data cleaning is included in every package!
Can you work with large datasets?
Yes! I have worked with datasets of 100,000+ rows. No problem!